Analyze Org Charts
Turn CRM Data into Actionable Insights
Turn your CRM Data into Insights with these visualization features
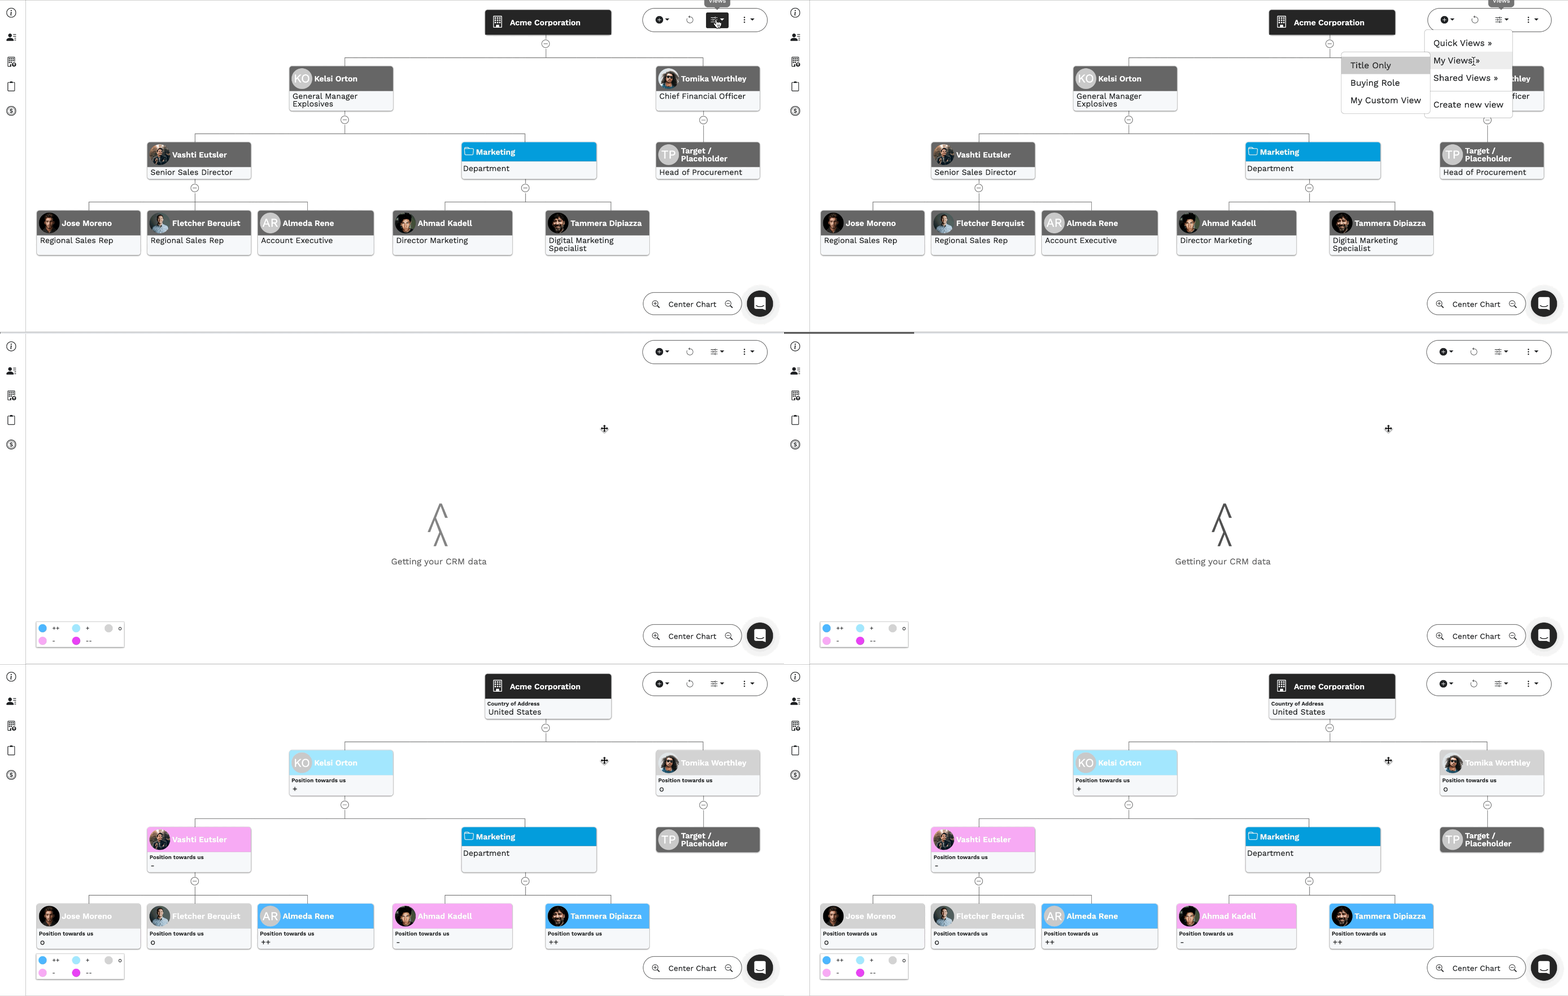
Heatmaps
Instantly turn your org-chart into an interactive heatmap
Based on CRM Activity metrics or Deeals
Identify engagement gaps and pinpoint where action is needed
Custom Views
Create multiple views of your org-chart with different CRM data
Apply custom colors driven by your CRM data
Generate custom heatmaps for your own data
Share customized views and coloring settings with your team
Advanced Data Mapping
Store relationship data solely in your CRM
Making your CRM the single source of truth
Ensuring top-tier data security and compliance
How B2B Sales Teams benefit from Account Plan Analytics
- Stronger Pipeline Growth through deal analytics
- 15% boost in Close Rates through better account visibility and multi-threaded engagement.
- More Accurate Forecasting – Data-driven reporting
- Reduced Admin Work with automated reports & sharing
- Better Sales Execution – detect deal risks earlier with real-time analytics
Frequently Asked Questions about Account Plan Analytics
-
Having visual account plans allows to mitigate risks earlier and identify areas for enhanced activity at a glance.
Companies using our insights-driven org-charts report higher close rates, faster deal cycles, and more pipeline generation.
-
Absolutely. With advanced data mapping, we don’t store your CRM data outside your CRM, ensuring compliance and top-tier security.
-
It’s plug-and-play with your CRM. No complex configurations—just immediate, actionable insights.
-
CRM data alone doesn’t provide a clear relationship map or engagement insights. Our visualization tools turn scattered data into an intuitive, action-driven strategy.
-
No. Unlike static dashboards, our org-chart views provide interactive, real-time insights tailored to sales execution, not just reporting.
More on Account Analytics
Upgrade your B2B Enterprise Sales today with vizrm Account Analytics
14-day trial. Zero Cost. Full Access. No credit card.


